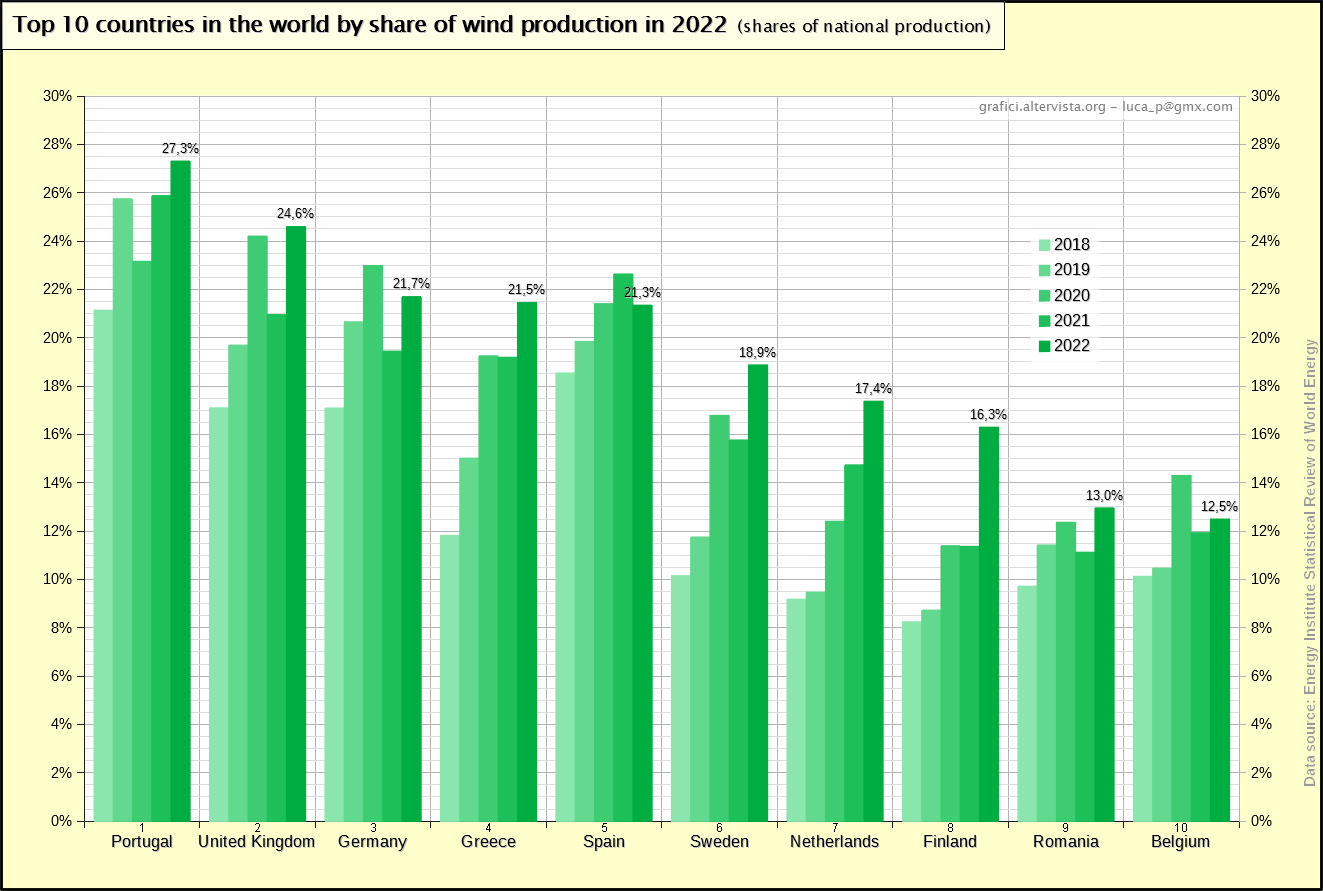
These are the two main new renewable sources; let’s see how much space they have managed to gain in the electricity system of the countries that have decided to use them more.
To make the figure more meaningful, only countries with total domestic electricity production of at least 50 TWh as an average over the past 5 years were considered. Let’s start with wind power:
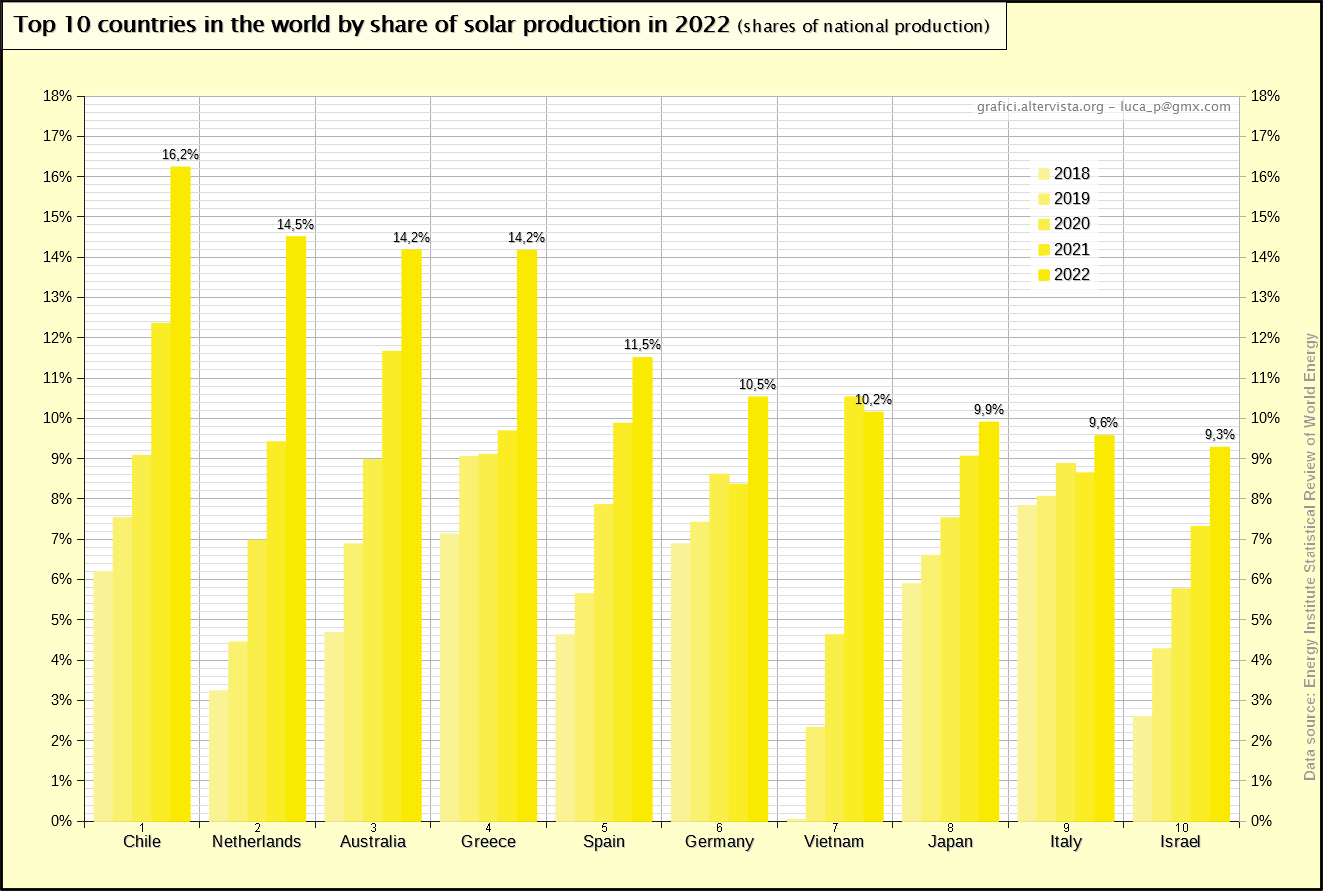
 Let’s now look at photovoltaics, or rather, solar, as the production of concentrating thermal plants (CSP) is also included, which however is insignificant:
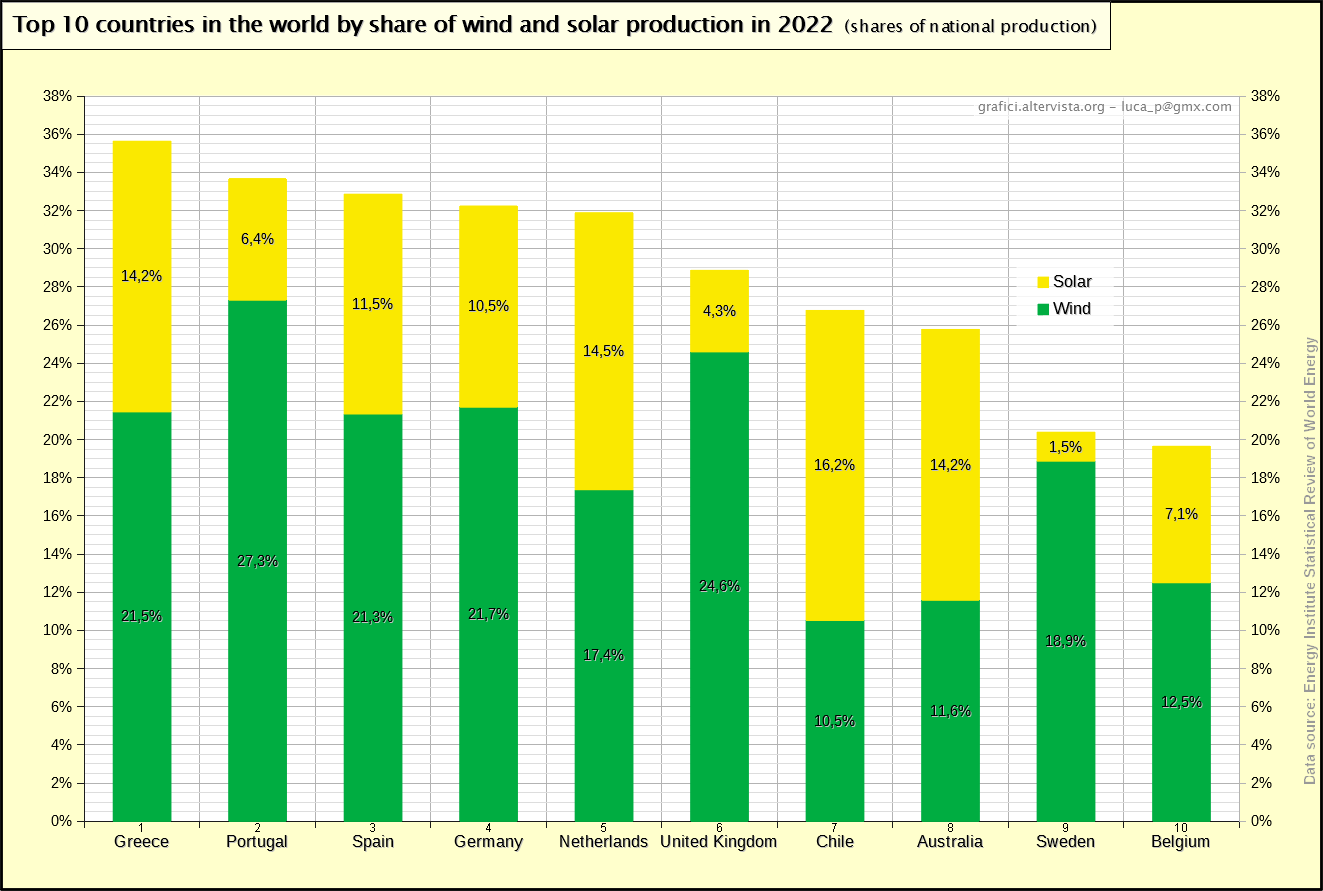
 Finally, let’s see the ranking of the countries that have the largest share of wind and solar combined:
* * * * *
The old graphs are visible here:
-
-
- 2018 – Wind; Solar; Wind+Solar
- 2019 – Wind; Solar; Wind+Solar
- 2020 – Wind; Solar; Wind+Solar
- 2021 – Wind; Solar; Wind+Solar
-
It should be considered that data are often subject to subsequent adjustments, so old charts may show outdated data.
Sources
Data are taken from the Energy Institute website section “Exploring Energy; Statistical Review of World Energy; Resources and data downloads” by downloading the file “Statistical Review of World Energy Data”. The electricity production data can be found in the folders marked with the term “generation” and the values in TWh.
This institute inherited and took over the energy statistics previously published by BP.
The percentages are calculated by dividing the productions of the two sources considered by the total electric production.